The ADAS project, led by Dr Julie Smith, used data from one of the world’s longest-standing research projects on wheat diseases, the AHDB Fungicide Performance Curves, alongside published analysis of the Defra Survey of Crop Pests and Disease. Its goal was to model how fungicide programmes reduce disease severity.
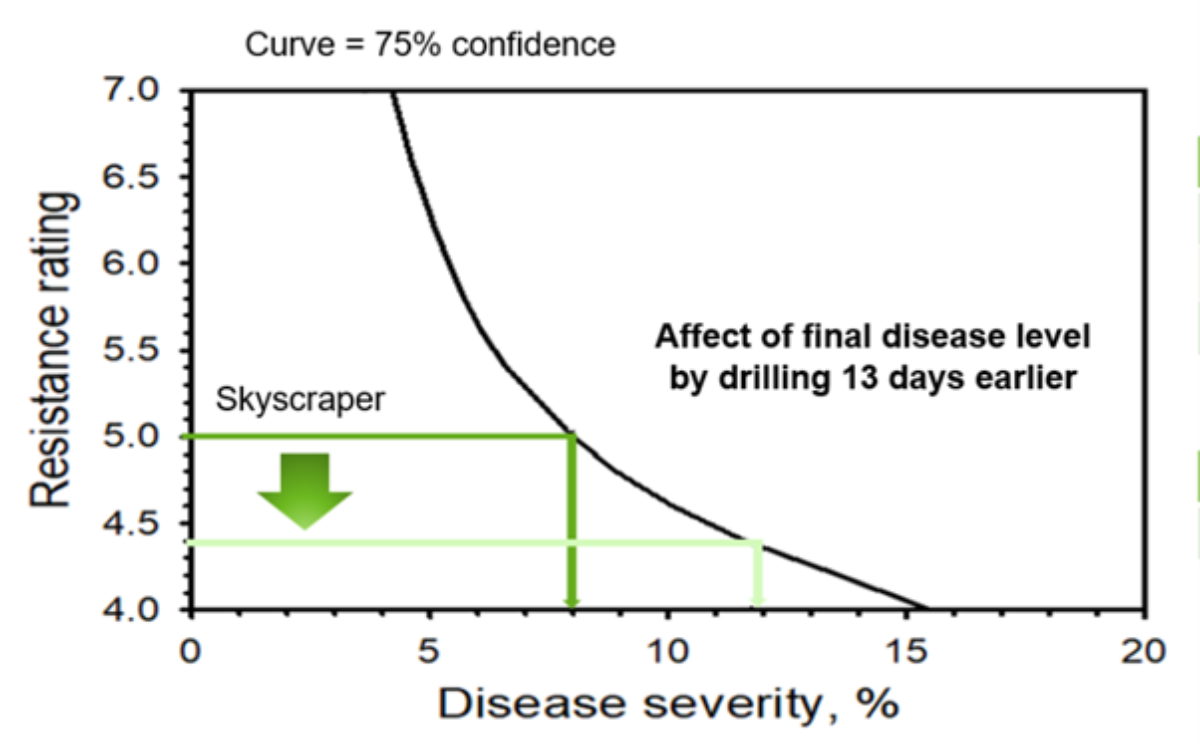
BASF overlaid the AHDB work on the impact of drilling date on AHDB Recommended List (RL) resistance ratings to discover the impact of upgrading fungicides at T1.
World-leading research
UK growers and agronomists are well-used to the annual dissemination of the Fungicide Performance Curves, but ADAS researcher Dr Frank van den Bosch highlights how unique and valuable the datasets are.
“The UK’s system is unique in the breadth and depth of the data and is an under-utilised resource. This model could not have been developed anywhere else in the world, as such long-term data sets are not collected,” he says.
The AHDB Fungicide Performance Curves incorporates 30 years of results, totalling 273 ‘site years’ of data points. Defra’s Survey of Crop Pest and Disease dates back 50 years and contains around 300 random wheat crops per year which are visited each year and scored for their pest and disease damage. Defra also collects data on the varieties and agronomic practices used.
The new model
“The model we developed uses this data to show how much disease you can expect in a crop, given the RL septoria resistance rating of the variety and the chosen fungicide programme,” explains Frank.
“There are two sources of variability. One is the disease pressure which changes from year to year, the other is the fungicide programme efficacy which is different across the years and location of the crop.”
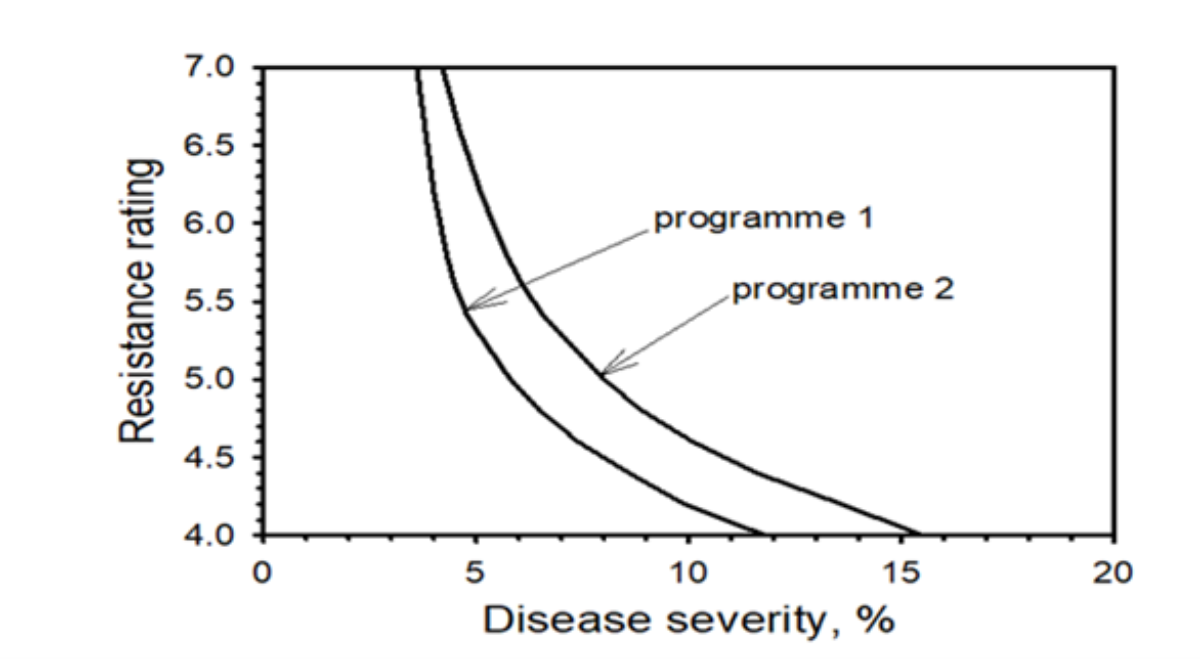
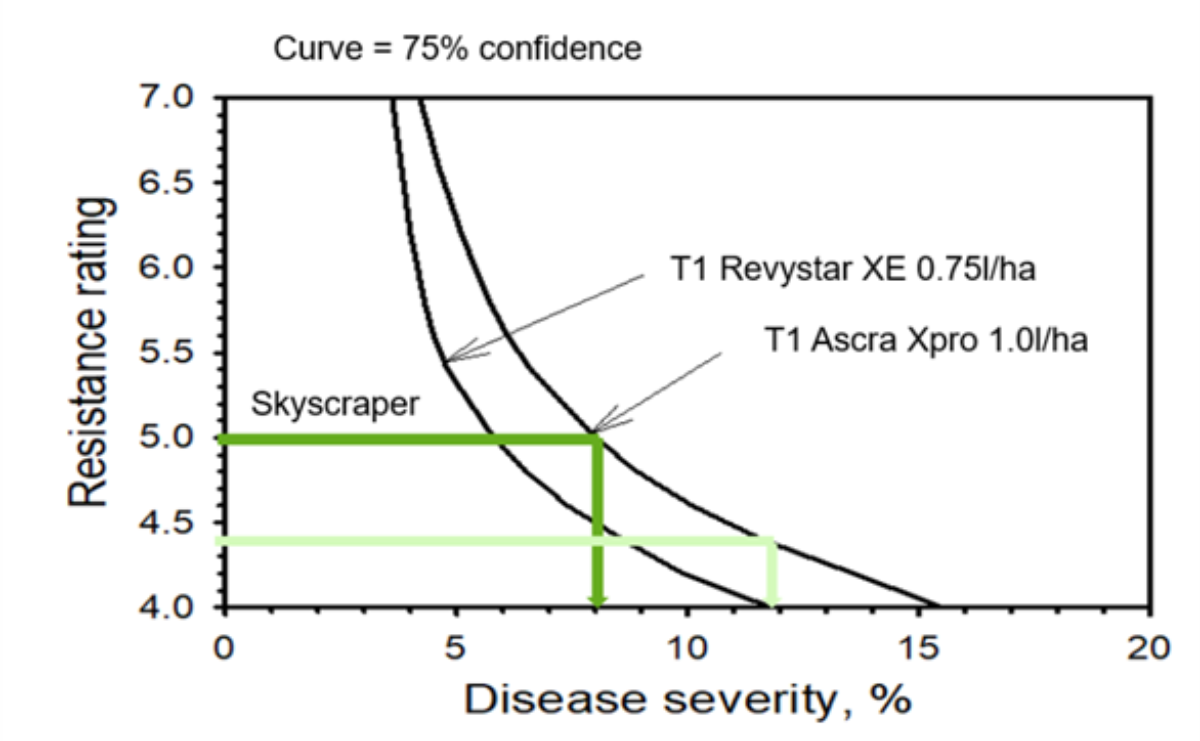
When Frank’s model combines these two sources of variability, it produces a curve, to the left of that curve are 75% of cases.
For Frank, the most surprising finding of the research was the discovery that the variability in the fungicide efficacy is the same for all fungicides.
“It doesn’t matter whether you’ve used an SDHI, an azole or a QII, the efficacy variability is identical. This is important as it allows us to model any combination of fungicides within a programme.”
ADAS modelled a variety of programmes, typical of those seen on farm in recent years, such as Revystar® XE at T1 followed by Univoq at T2 and Proline at T3 (programme 1). Frank went on to compare various scenarios including, switching the Revystar® XE for Ascra Xpro at T1 (programme 2).